Tableau Dashboard 1
a project with a interactive dashboard to visualize the real estate data in Washington, USA
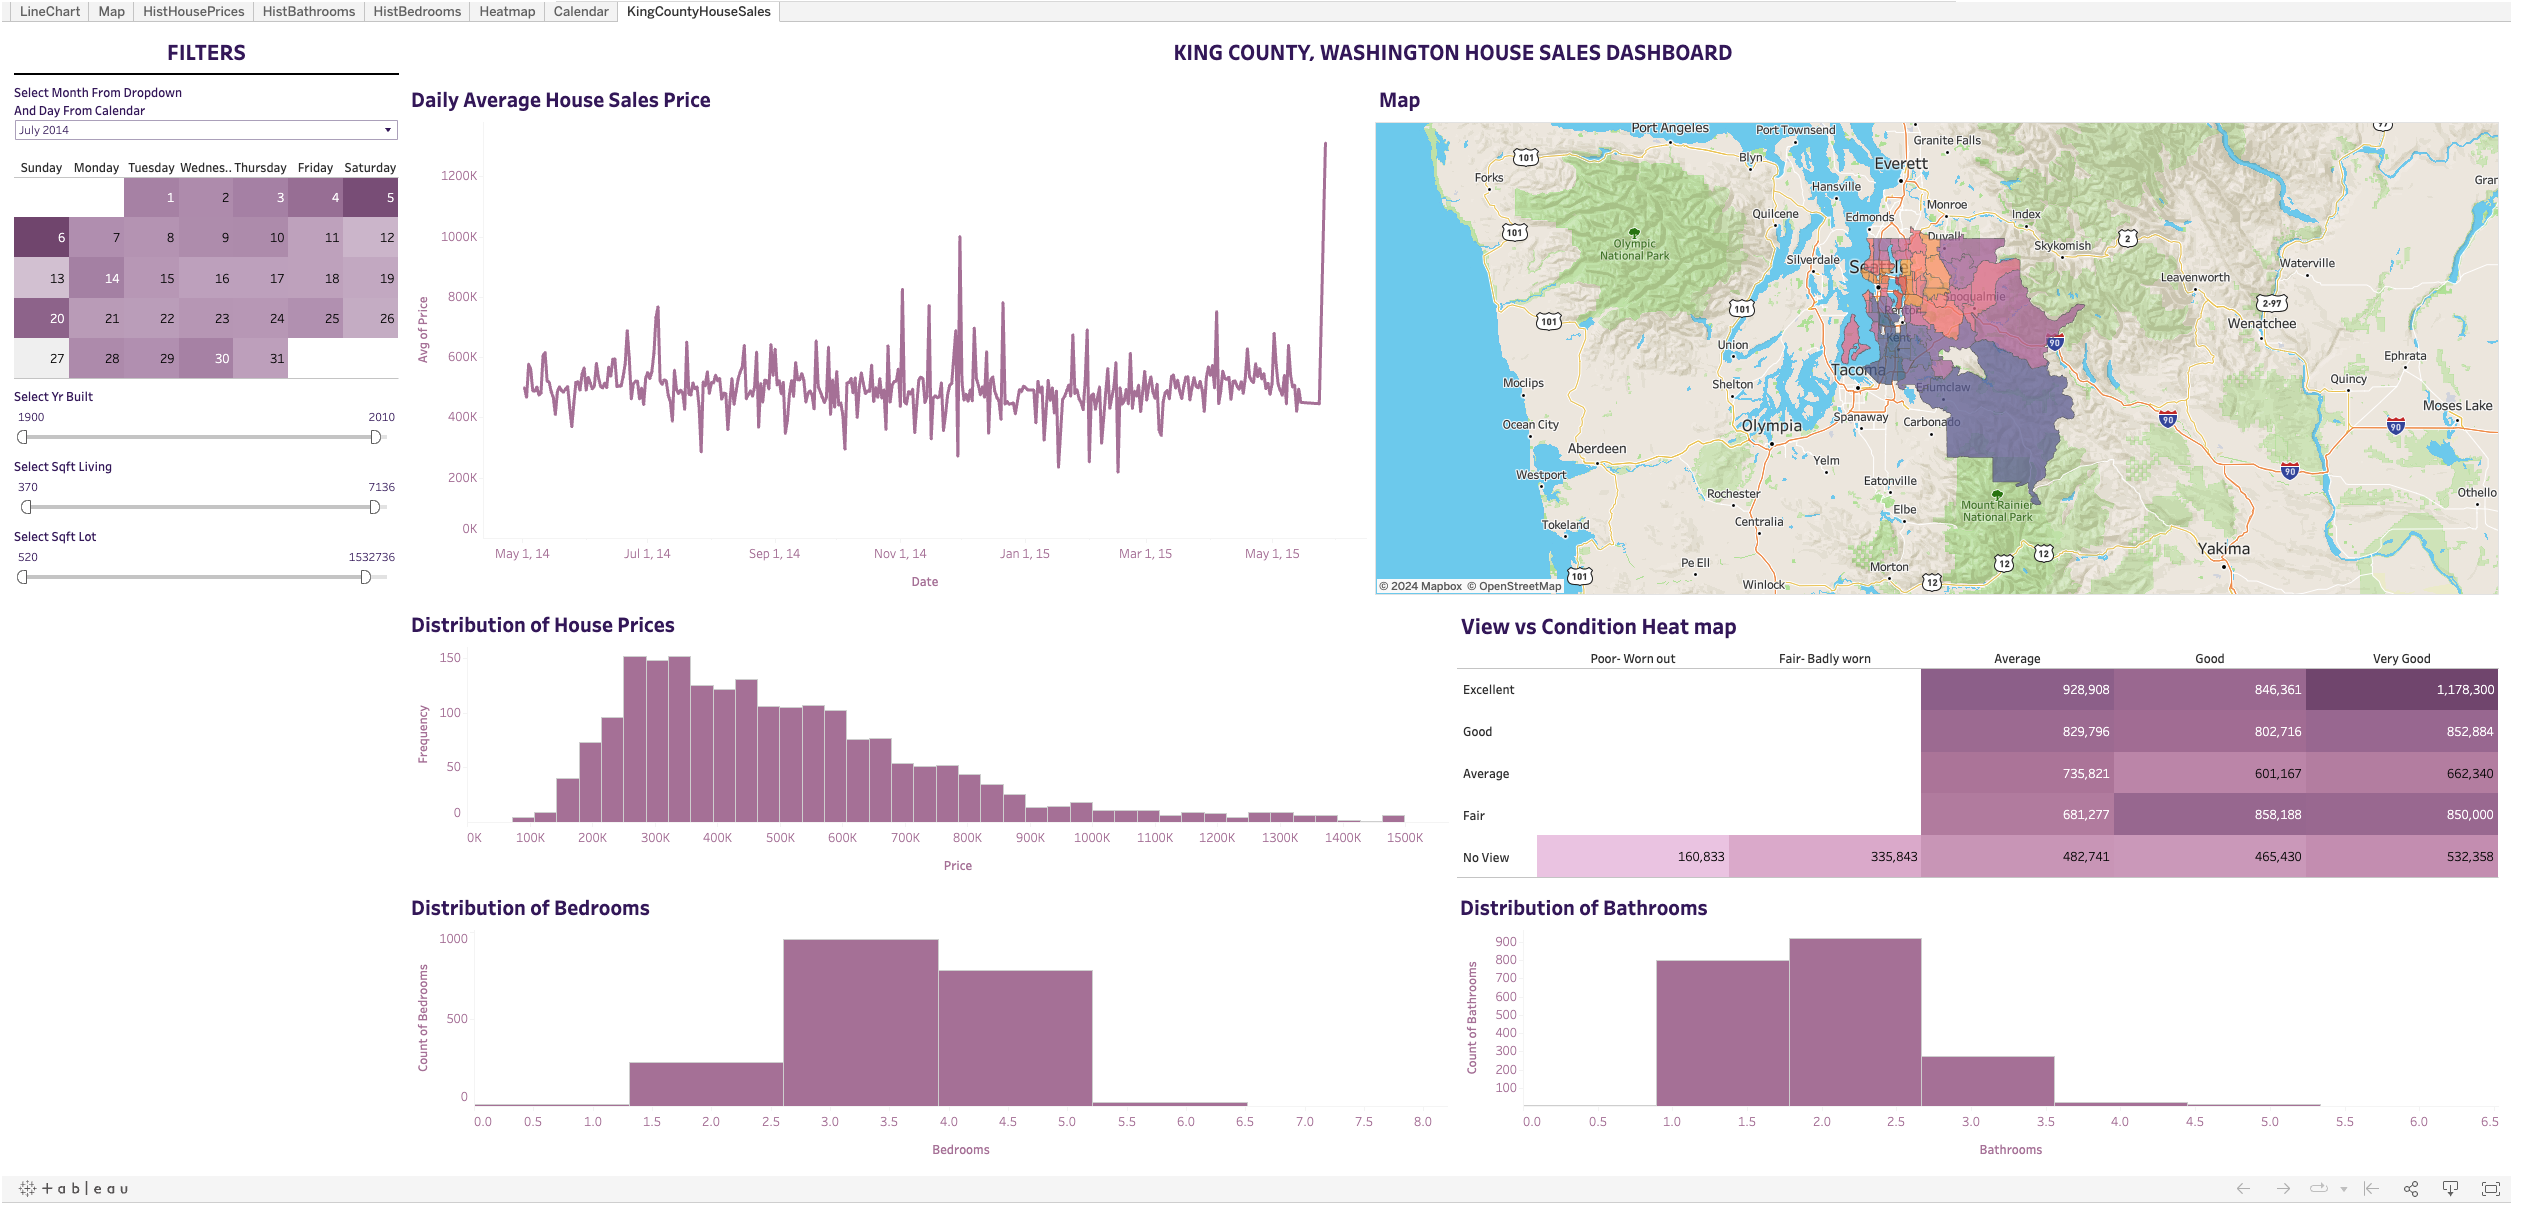
I have studied abroad in Seattle as an exchange student in 2018-2019. I love the city and the people there. Because my family is involved in real estate, I am interested in the real estate market. I have collected the data of the house sales in King County, Washington, and created a dashboard to visualize the data. The dashboard is created by Tableau. The dashboard is interactive and you can filter the data by different attributes. The dashboard is also published on Tableau Public. You can see the dashboard by clicking the link below. Dashboard Link
See more about the Washington Real Estate dashboard

The dashboard is very interactive. You can filter the data by different attributes. The data is stored in a csv file. The data is collected from Kaggle [House Sales in King County, USA].